
Making complex
carbon data
useful.
At Mondra, I led UX and product design for a platform helping food businesses understand their environmental impact and explore how to reduce it.
My work combined building the design team, shaping product direction and designing the detailed interactions that made complex data usable.
Research changed
the audience.
Product Development shifted towards suppliers’ product developers—the people developing the food.
A practical way
to find hotspots.
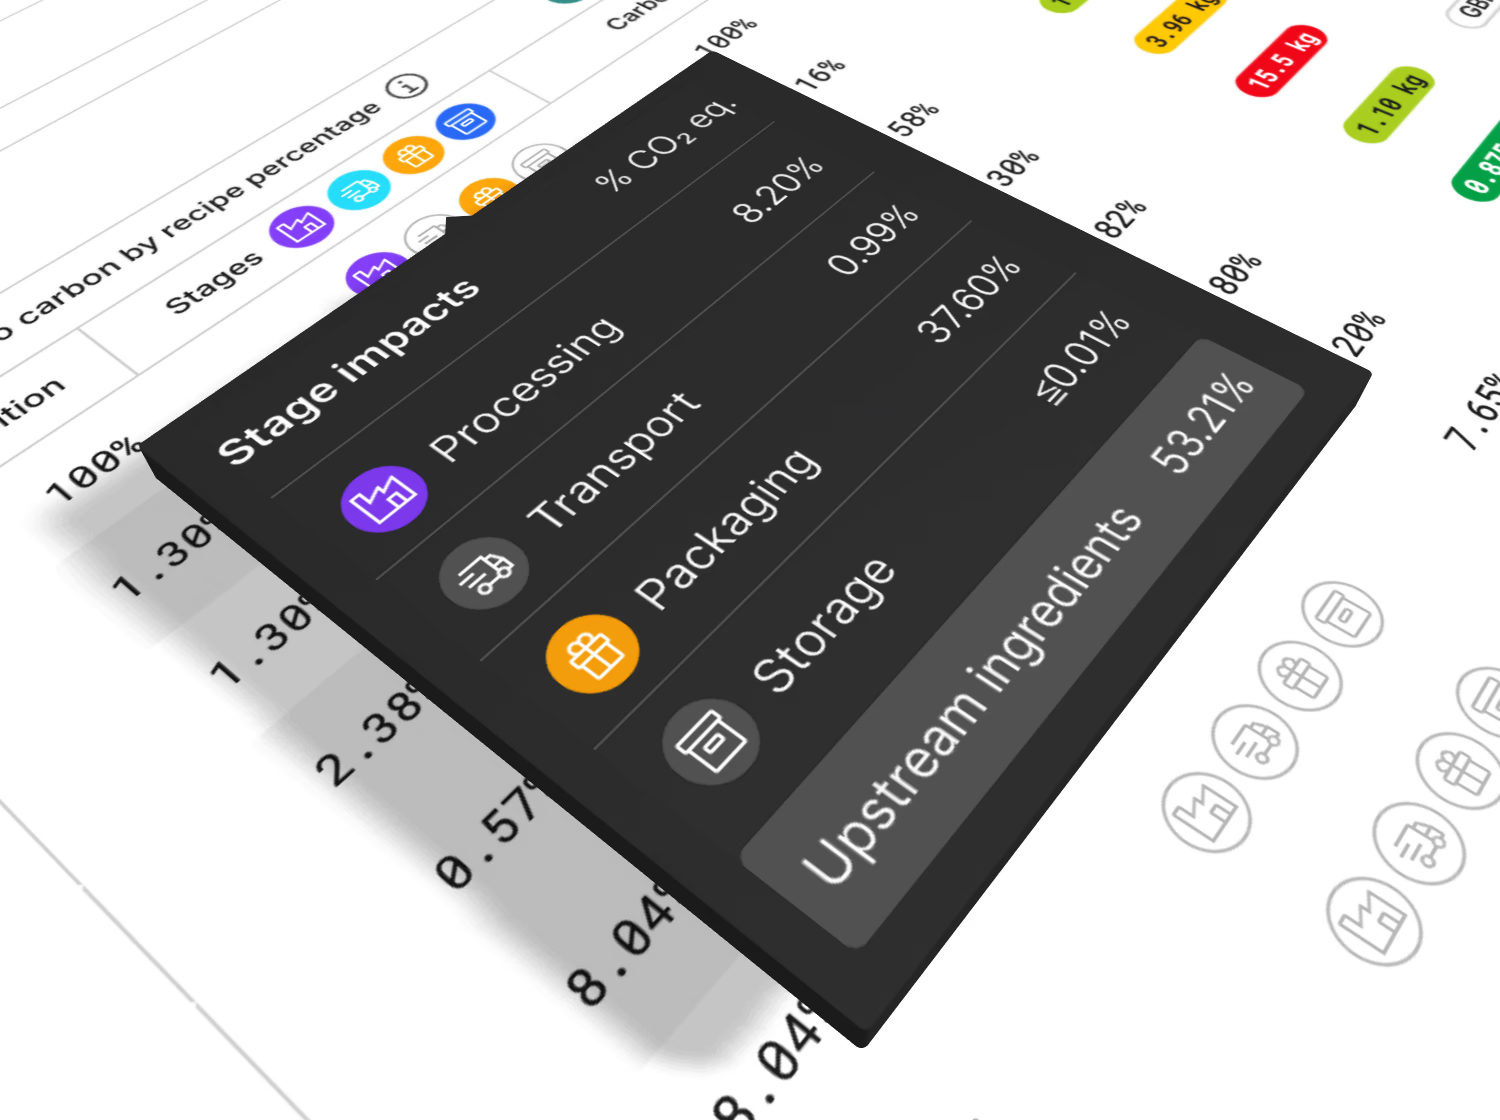
Client participants described the stage breakdown as their most-used feature for finding carbon‑reduction opportunities.
7 minutes
to under 1.
Mondra Lite sign-up completion time, before and after streamlining the journey in testing.
Setting direction.
Staying close
to the work.
I built and managed Mondra’s design team, developing a senior designer into management and lead responsibilities over three years.
Alongside that leadership role, I remained directly involved in product design. I redesigned category navigation, specified and designed the Contribution tree, and designed feedback for recipe reformulation.
I also directed customer engagement work and collaborated with Product, Engineering and Science on how the platform presented complex information.
The examples below include both my own design decisions and projects delivered with the wider team.
Research changed
who we designed for.
From testing scenarios to supporting the people developing the food.
The tool originally called Scenario modelling was aimed at sustainability teams within retailers. They could explore changes to recipes before taking a reformulation proposal to their commercial teams.
I led research to test that direction. I shortlisted participants, arranged and chaired the sessions, and produced findings reports that I presented to stakeholders. Alongside these sessions, I attended client workshops to understand how the tool would fit into customers’ work.
Expert scrutiny challenged the original focus
The strongest signal came from independent consultants working in food product development. They scrutinised the existing product and the designs I presented for its future direction.
Their candid feedback, combined with findings from the other research sessions and client workshops, pointed towards suppliers’ product developers—the people developing the food—as the audience most likely to turn the tool’s findings into action.
The original retailer use case remained valid. But the research gave us a stronger basis for focusing the experience on food producers.
Scenario modelling
Retailer sustainability teams
Product Development
Food producers’ product developers
A change of audience became a change of product
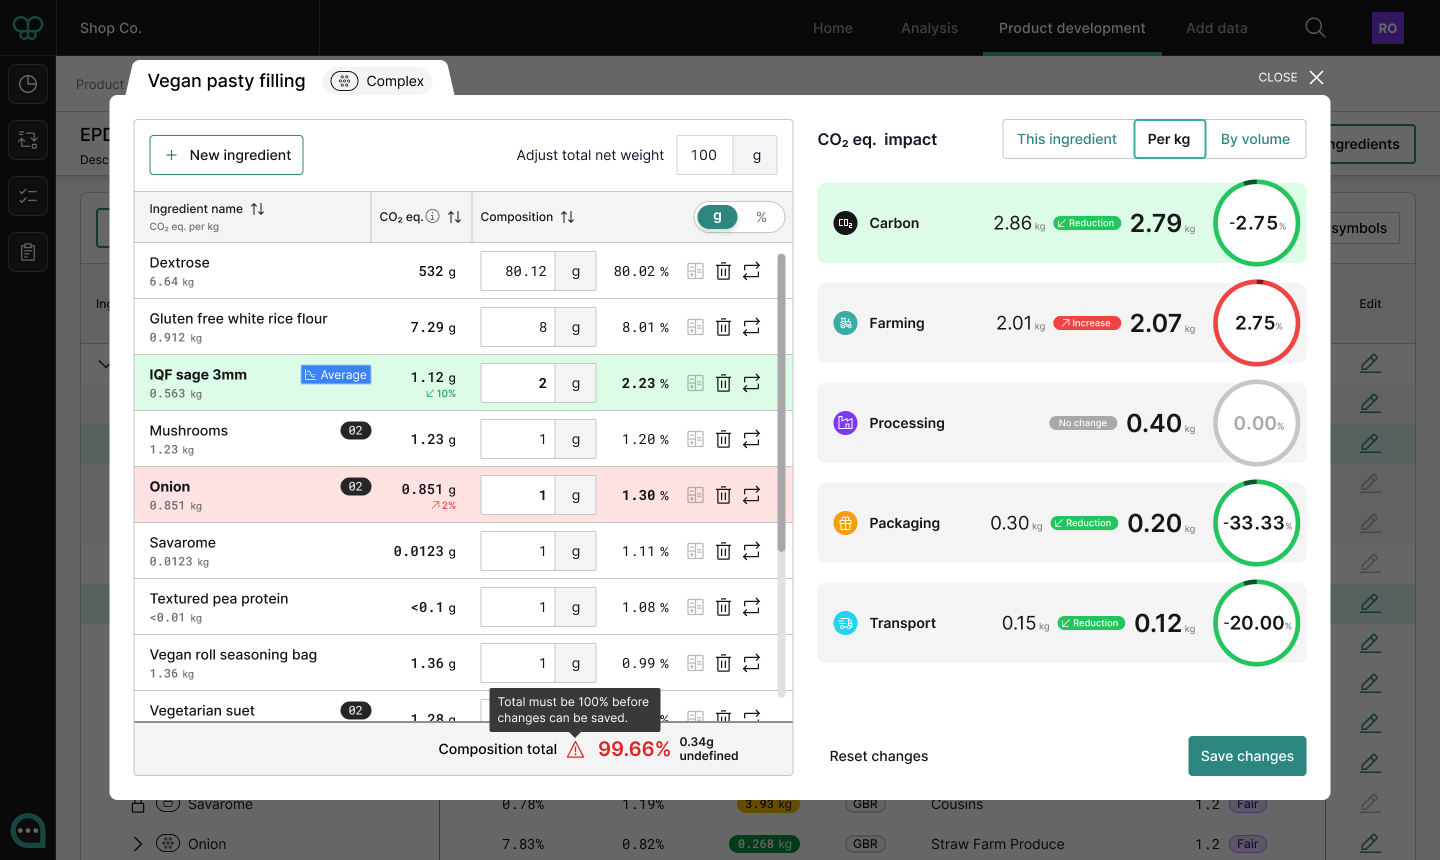
The tool became Product Development, with journeys optimised for adding and swapping ingredients.
This went beyond a name change. It shifted the design focus from helping sustainability teams prepare a proposal to helping product developers explore reformulation directly.
Make the effect of each change immediate
I designed instant, animated feedback so users could see how recipe changes affected sustainability at both product and category level.
The sustainability team at Marks & Spencer praised the use of animation for making a complex tool a delight to use.
Help people find
where change
would matter.
nodes in its full supply chain
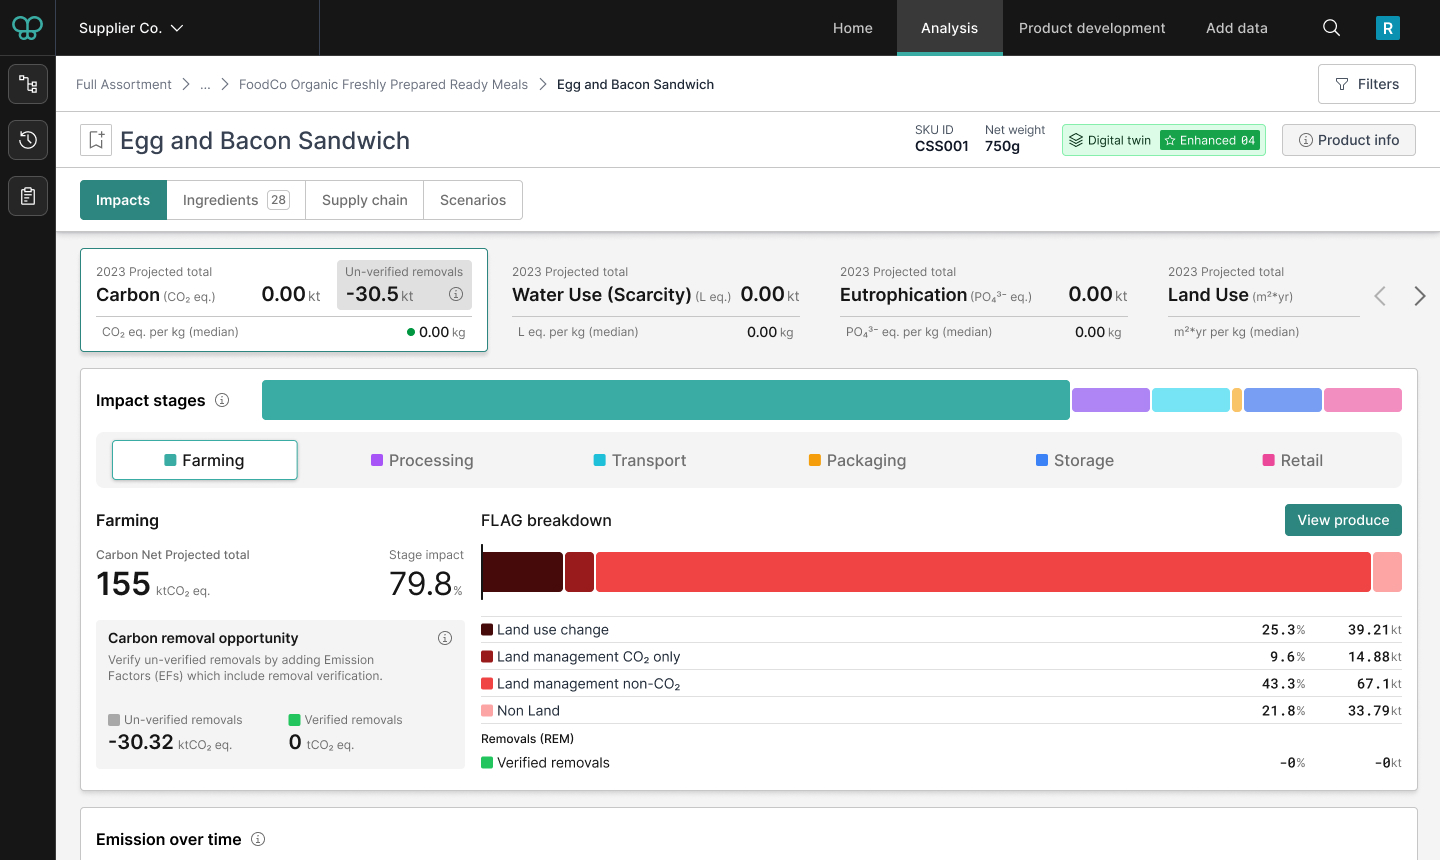
A food product’s carbon footprint can involve a huge network of ingredients, suppliers and processes. Users needed ways to move through that complexity, compare contributions and identify where to investigate.
Make the hierarchy easier to navigate
When I joined, users navigated through multiple dropdown menus. I designed a sidebar that combined compact access to the platform’s tools with an expandable product hierarchy.
It also showed carbon contribution data across the assortment. Following the redesign, support requests about finding products and categories decreased.
Make the largest contributions visible
I designed a breakdown showing carbon impact across farming, processing, packaging, transport, storage and retail. The highest-impact stage appeared first, alongside an explanation of how the figures were calculated.
In customer feedback sessions, client participants described it as their most-used feature for identifying opportunities to reduce carbon.
Provide a route into the detail
For deeper investigation, I specified and designed the Contribution tree: an expandable table using master/detail rows. Users could navigate the supply chain, compare contributions and inspect carbon hotspots within a structured hierarchy.
Reduce the effort
required to
participate.
From supplying data to getting started.
The platform depended on people supplying data and returning to use it. That made data collection, onboarding and the first experience after login important parts of the design work.
Keep customers involved in data collection design
“Add data” was a major team project for collecting farm-level sustainability information from food suppliers. I was responsible for its UX and design.
We built prototypes, tested them with customers and kept those customers involved through the first release and subsequent iterations. The resulting experience combined adaptive, multi-step data collection with feedback throughout the process.
Challenge what needs to happen upfront
For Mondra Lite, I challenged the amount of information requested during sign-up and worked with design and product to streamline the journey.
Completion time in testing fell from seven minutes to under one.
Give different roles a relevant starting point
I directed a customer engagement project and researched what users needed to see first. We designed role-specific homepages that combined a useful snapshot of data with access to frequently used features.
Original sign up and onboarding - 7 mins + call + 24hr onboarding time
- Step 1Input email
- Step 2Validate email
2FA - Step 3About you
[4 fields] - Step 4Your company
[5 fields] - Step 5Company info
[4 fields] - Step 6Review data
& confirm - Step 7Book a call
[HubSpot embed
4 fields] - Step 8Have call with
onboarding team
Agree cost
Pay invoice - Step 9Wait up to 24hrs
for account
activation email - Step 10Sign in
- Step 11Upload product data
Revised self service onboarding - 1 min
- Step 1Input email
- Step 2About you
4 fields inc. company name - Step 3Select plan and pay by card
- Step 4Auto sign in
Verify email
Add extra data (opt) - Step 5Upload product data
A simpler sign up journey
The original sign up journey put a lot of steps and a sales call between a potential customer and getting started with Mondra. The revised flow prioritised customer sign up over validation and extra data fields. This information was collected after sign-up, reducing the steps-to-value by over half.
From conversation
to action.
I shaped and named Sherpa, Mondra’s AI assistant for exploring supply-chain data and acting within the platform.
I designed prompts, feedback and layouts that showed the conversation alongside AI-initiated actions. I also defined its language style and co-designed compact data views, working with Science and Product on accuracy and compliance.
See the
details in motion.
This training video, which I created for Mondra partner IGD and its customers, demonstrates a selection of the features described above.
It combines Figma prototypes, platform recordings and animation. I wrote the script and generated the voiceover using ElevenLabs.
There’s more
behind the screens.
I can talk through the research, design decisions and collaboration behind this work in more detail.
